Maximum A Posteriori Calculations
BayesEoR includes a module, bayeseor.analyze.maxap, for performing Maximum A Posteriori (MAP) calculations. The bayeseor.analyze.maxap.MaximumAPosteriori class handles all of the setup and calculations and requires only a path to a configuration yaml file as input. Please see MaximumAPosteriori for more details. Additional kwargs can be passed on instantiation for more advanced uses (see Additional Uses for more details).
Basic Usage
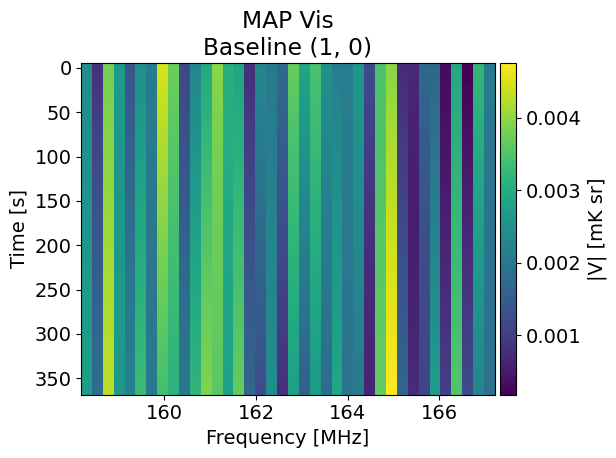
In the code block below, we compute the MAP visibilities for the test data provided with BayesEoR using the bayeseor.analyze.maxap.MaximumAPosteriori class and plot a MAP visibility waterfall.
import numpy as np
import matplotlib.pyplot as plt
from bayeseor.analyze.maxap import MaximumAPosteriori

# By default, no verbose output is printed. For verbose
# output, add the verbose=True kwarg to the call below.
maxap = MaximumAPosteriori(config="example-config.yaml")

# Compute the MAP model coefficients, visibilities, and
# log posterior probability for a given power spectrum.
# This is the expected amplitude for P(k) for the test
# data in units of mK^2 Mpc^3.
map_coeffs, map_vis, log_post = maxap.map_estimate(
    ps=214777.66068216303
)

# Extract per-baseline visibilities from the MAP
# visibility vector for comparison with the input data.
bl_vis = maxap.extract_bl_vis(map_vis)

# bl_vis is returned as a dictionary with keys of
# baseline antenna pairs (ant1, ant2) or baseline index,
# e.g. 0, 1, 2, if the antenna pairs are not present
# in the instrument model.
if "antpairs" in maxap.__dict__:
    key = maxap.antpairs[0]
else:
    key = 0

# Visualize a MAP visibility waterfall
df = maxap.freqs[1] - maxap.freqs[0]
extent_freq = [
    (maxap.freqs.min() - df/2).to("MHz").value,
    (maxap.freqs.max() + df/2).to("MHz").value
]
dt = (maxap.jds[1] - maxap.jds[0]).to("s")
extent_time = [
    -(dt/2).to("s").value,
    (maxap.jds[-1] - maxap.jds[0] + dt/2).to("s").value
]
fig, ax = plt.subplots()
ax.set_title(f"MAP Vis\nBaseline {key}")
ax.set_ylabel("Time [s]")
ax.set_xlabel("Frequency [MHz]")
im = ax.imshow(
    np.abs(bl_vis[key]),
    extent=extent_freq+extent_time[::-1],
    aspect="auto"
)
cb = fig.colorbar(im, ax=ax, pad=0.01)
cb.set_label("|V| [mK sr]")
fig.tight_layout()
Warning
The bayeseor.analyze.maxap.MaximumAPosteriori class calls bayeseor.setup.run_setup as part of __init__. This will build the matrix stack, which is required for MAP calculations, if it doesn’t already exist at the array directory path created from the configuration yaml file.
The above code will produce the following simple plot of the absolute value of the MAP visibilities for baseline (1, 0).
Additional Uses
The bayeseor.analyze.maxap.MaximumAPosteriori class also allows accepts data_path and array_dir kwargs which allow the user to specify a data file and/or array directory that differs from that in the specified config file. This is useful for testing different model configurations for the same data, by specifying array_dir, or testing model viability using different datasets, by specifying data_path. Specifying either data_path or array_dir will add a bit of computational overhead as we need to recompute the necessary matrices/vectors used in the posterior calculation.